In a previous post, I wrote about DATA VISUALIZATION or, for short, DATA VIZ.
There are those who are familiar with the concept and others who are less familiar – but both will automatically think of tables, graphs, pie charts and columns.
From a broader perspective, I always tend to think of my audience as people who are less attached to numbers.
As the presenters we are often swimming in the data. We understand exactly what everything means; we understand the context and the structures of the databases, and it is clear to us why the information is important.
But, a lot of viewers don’t always understand the information the same way. They may not even understand why particular information is important.
They do understand that you know that the information is important and that there must be something they need to know or do.
But the distance between this understanding and their ability to act based on the important information you presented is great. Why is that?
I recommend further reading regarding this question, in an article I wrote together with my dear colleague Linda C. Gross in our joint venture www.nondatapeeps.com.
The other question is whether they’ll remember this information a week after watching it.
When it is important to us that the viewers will not only perform, but will also be “agents of change” for us, we should know how to direct their attention to the same 10%. Give them tools to remember and repeat the important information.
In order to make viewers remember and to act according to the information over time, two conditions must exist: connection and recall.
There are many techniques to establish a connection between the information and the viewer. One of the best is to tell a story.
How many times could you repeat a successful joke? Jokes make it very easy for us to connect: we remember the “punch,” and therefore we have no problem telling them over and over again, even if in slightly different words.
The same goes for a story you’ve heard, a movie or a series you’ve watched – but there, too, the story or the movie should leave a very strong impression to be remembered over time.
Compared to the joke or story, how many times have you been able to recall sales figures, especially if sales is not your role within the company? Or how about employment data in the economy, when it’s not really about you? Or, as in the example I will soon refer to, how many tons of garbage we produce?
One of the problems that we have, for most people, is to connect with large numbers. Yes, we hear or see the number, but for numbers of a certain scale, that’s all it is – a number.
When someone throws out a number like a million something, that doesn’t immediately mean anything to us. Is that a lot or a little in relation to what you’re talking about?
In order for us not only to understand the data, but also to connect and remember it – that data must be vivid to us. We must be able to imagine it. From the moment we create a picture for ourselves in our head, it becomes much easier for us to remember.
Let’s see an example:
Waste recycling. It’s in each of our hands.
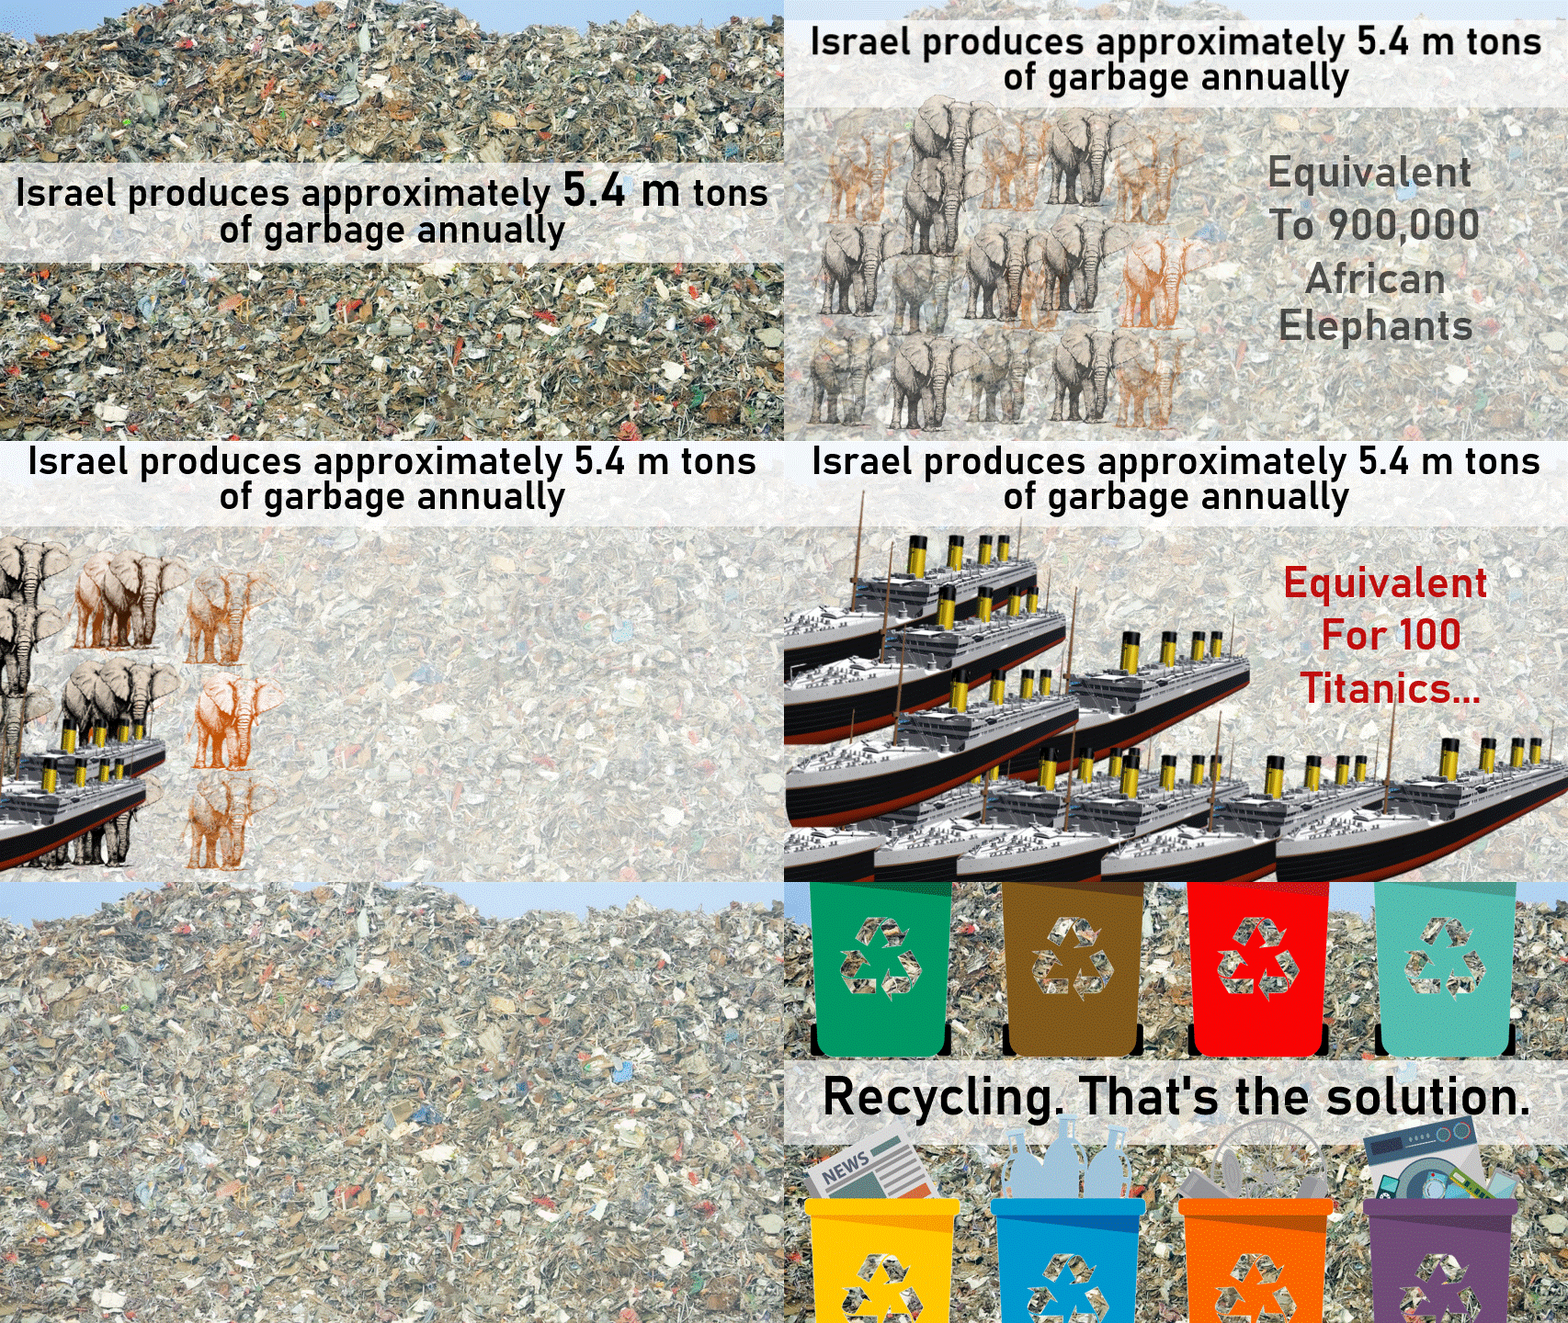
One of the bits of data I was exposed to in recent years was the amount of garbage we produce every year. Here in Israel: 5.4 million tons.
Sounds like a lot, right? Sounds like a big number – but there it stays. It doesn’t really make a dent.
It was only when I wanted to write this post and was looking for an example that I remembered this number, which had made me click my tongue at the moment I heard it but was quickly forgotten.
You might as well have told me we make “lots and lots of trash.” That’s how it registered with me.
I promise you I won’t forget that figure next time. Why? Because now it’s easier for me to understand, connect and remember:

What this presentation does very successfully is “chunking” the large number into familiar visual elements.
The Titanic is understood to have been the largest vessel of its day (although there are now much larger vessels, they are not iconic images in our minds like the Titanic).
The same goes for an African elephant. It’s one of the biggest and heaviest animals.
The reason that the large number is illustrated through several examples is simple: each of us connects a little differently to the examples.
After seeing these visual examples, we are all starting to be much clearer about what 5.4 million tons means. Even if we do not specifically remember this large number – there is a good chance we’ll remember the smaller numbers used to illustrate it: remembering 100 Titanics or about 900,000 lephants is a lot easier – even if the number here is large on its own, we can form a picture of a few thousand of elephants and realize that 900,000 elephants is a huge number. Easier then imagining 5.4 tons…
Most importantly, we will connect to the fact that this is a very large amount of garbage and that we should start doing something about it: Recycle.
We use cookies to improve your experience on our site. By using our site, you consent to cookies.
Manage your cookie preferences below:
Essential cookies enable basic functions and are necessary for the proper function of the website.
These cookies are needed for adding comments on this website.
Statistics cookies collect information anonymously. This information helps us understand how visitors use our website.
Google Analytics is a powerful tool that tracks and analyzes website traffic for informed marketing decisions.
Service URL: policies.google.com (opens in a new window)